Measuring the Popularity of Soccer in the USA
Published: 06/11/2014
Tomorrow is the start of the 2014 World Cup, so I thought I would take a moment to discuss the popularity of soccer in the United States. It is hard to pin down the true popularity of a sport, but I thought two important measures could serve as a barometer of the sport's popularity in the USA: average attendance numbers for MLS (Major League Soccer) games and MLS revenue. These two measures do not fully capture the popularity of the game in the USA, but they certainly establish a sort of minimum level of interest. Beyond the fact that attendance and revenue are not perfect measures of a sport's popularity, there is something else to keep in mind. Many American soccer fans (especially, 1st generation Americans) primarily follow soccer from other countries, so the MLS numbers are not a true reflection of the popularity of soccer in the USA. For example, NBC reported that almost 5 million Americans watched their English-language coverage of the last 10 matches of the English Premier League this season. With those caveats in mind, look at the three charts below:
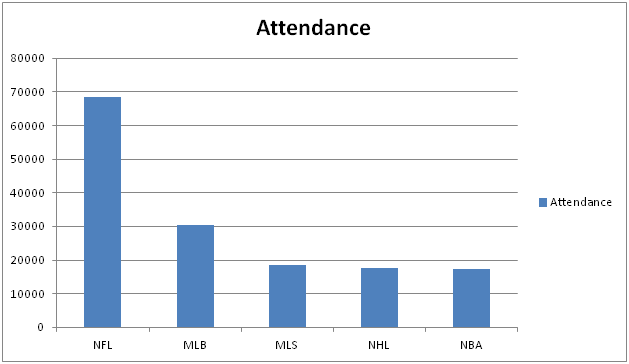
The average (per game) attendance for the 2013/2014 seasons of the NFL, MLB, NBA, NHL, and MLS. This chart shows that the MLS has the third highest average attendance at its games; however, the NHL and NBA attendance numbers are limited by the fact that they are indoor sports which are played in venues with smaller capacities.
This next chart, which I borrowed from Wikipedia, shows the annual revenue for the major American sports. It also includes TV revenue. This chart shows that the MLS has a long way to go to in terms of revenue generation. The NBA earns ten times the revenue of the MLS, and the NHL earns 6.6 times the revenue of the MLS.
|
Annual revenue comparison |
||
|---|---|---|
| League | Total Revenue (bn $) | TV Revenue |
| National Football League | $9.00 | $5.0 bn |
| Major League Baseball | $7.00 | $1.5 bn |
| National Basketball Association | $5.00 | $930 m |
| National Hockey League | $3.30 | $600 m |
| Major League Soccer | $0.50 | $40 m |
This penultimate chart which I found in a 2013 Forbes article lists the revenue of each of the MLS teams for the 2012 season. One bright spot is that 11 of the 19 teams are profitable. Many of the world's soccer clubs operate at a loss every year, so the MLS is doing well in terms of profitability.
| Rank | Value ($M) | Revenue ($M) | Operating Income ($M)1 |
|---|---|---|---|
| Seattle Sounders | 175 | 48.0 | 18.2 |
| LA Galaxy | 170 | 44.0 | 7.8 |
| Portland Timbers | 141 | 39.1 | 9.4 |
| Houston Dynamo | 125 | 32.6 | 8.2 |
| Toronto FC | 121 | 30.9 | 4.5 |
| New York Red Bulls | 114 | 28.1 | -6.3 |
| Sporting Kansas City | 108 | 27.7 | 5.1 |
| Chicago Fire | 102 | 24.5 | -3.2 |
| FC Dallas | 97 | 24.2 | 0.6 |
| Montreal Impact | 96 | 26.2 | 3.4 |
| Philadelphia Union | 90 | 21.4 | 1.1 |
| New England Revolution | 89 | 17.1 | 2.6 |
| Vancouver Whitecaps | 86 | 23.0 | 0.0 |
| Real Salt Lake | 85 | 23.0 | -0.1 |
| Colorado Rapids | 76 | 18.1 | -2.9 |
| San Jose Earthquakes | 75 | 15.0 | -4.5 |
| Columbus Crew | 73 | 18.6 | -1.6 |
| DC United | 71 | 17.7 | -2.8 |
| Chivas USA | 64 | 15.0 | -5.5 |
| FORBES estimates; revenue and operating income is for 2012 season 1Earnings before interest, taxes, depreciation and amortization |
|||